You’ve just put together a great set of stats that you know your target audience will find fascinating. But how do you present them so they make an impact?
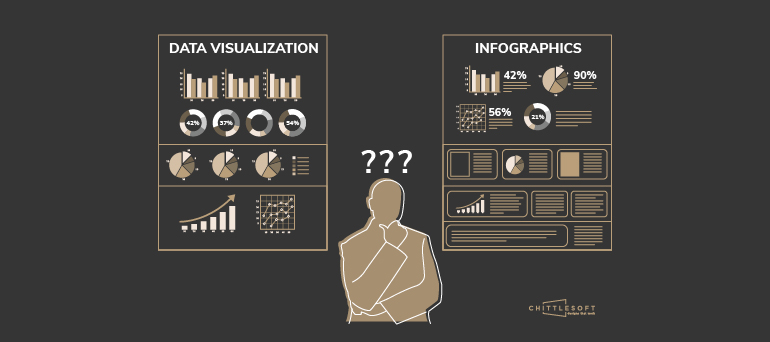
Two options you have are Data Visualization and Infographics. Both used to represent data visually, they are often mistaken for one another. However, telling them apart and knowing when to use each one can help determine how effective your content will ultimately be. Here’s what you need to know about them:
Objective vs. Subjective
Data visualizations keep things simple. They serve the purpose of representing the facts in a way that’s easy to understand, leaving room for interpretation and analysis. Infographics, on the other hand, guide viewers to a pre-planned conclusion. They offer a subjective view to evoke a desired response or make a compelling argument for something.
Automatically Generated vs. Manually Created
While this isn’t always the case, data visualizations can be generated automatically. There are a number of tools that will do this for you and will predict the type of format that suits the data best, including different charts and maps. Infographics can contain such automatically generated elements but are manually composed.
Raw values vs. Storytelling
Data visualization focuses on raw values, i.e., just the data. In the case of infographics, however, context matters. They use data to build stories and present those stories in specific contexts.
Keeping this in mind, here are a few ways you can use data visualizations and infographics to connect with your audience:
Data Visualization
Since they are objective, can focus on single data set, and can be automatically generated, data visualizations can be a quick and effective way to add interest to your next newsletter, report, or white paper.
a) Newsletters: If you share company updates and exciting findings in your newsletters, data visualizations could serve you well. They can work as a great way to present a new piece of information that your target audience would like to learn about.
b) Reports: Here, data visualizations can help you show stakeholders and clients your recent wins.
c) White papers: Data visualizations can help make your audience see your white paper as a credible source of information, which will help inform their opinions.
Infographics
When you need to tell a story, present information in a specific context, and lead your viewers to a predetermined conclusion, infographics are a good way to go.
a) Social media posts: Provide valuable information to your online community by turning infographics into social media posts. You can select different sections and turn a single infographic into several posts, getting plenty of value from it.
b) Case studies: These are designed to be informative, engaging, and compelling – all of which an infographic can help you achieve. Incorporate infographics into your case studies to offer your readers an enjoyable, low-effort way to get the information they need to make a decision.
c) Blogs: Infographics can help your blog post arrive at the desired conclusion more effectively. They can strengthen the message you are trying to convey while creating visual interest.
This tells us that there are so many creative ways to share data with your audience, depending on your requirements and objectives. Visme offers some interesting insights here on how viewers respond to different aspects of the data presented:
Does your data have a story to tell? We can help you find out! Get in touch with us here.
Many of our customers come to us in search of a good creative branding agency or digital design studio in Pune and then find all the design services they need under one roof. Learn how we use our design expertise to supplement your resources!
Key Sources:
https://blog.prototypr.io/
https://readwrite.com/
http://dbgroup.cs.tsinghua.edu.cn/
https://www.youtube.com/